River intake
Screened water enters a raw-water route. Confirm the pumps and lift.
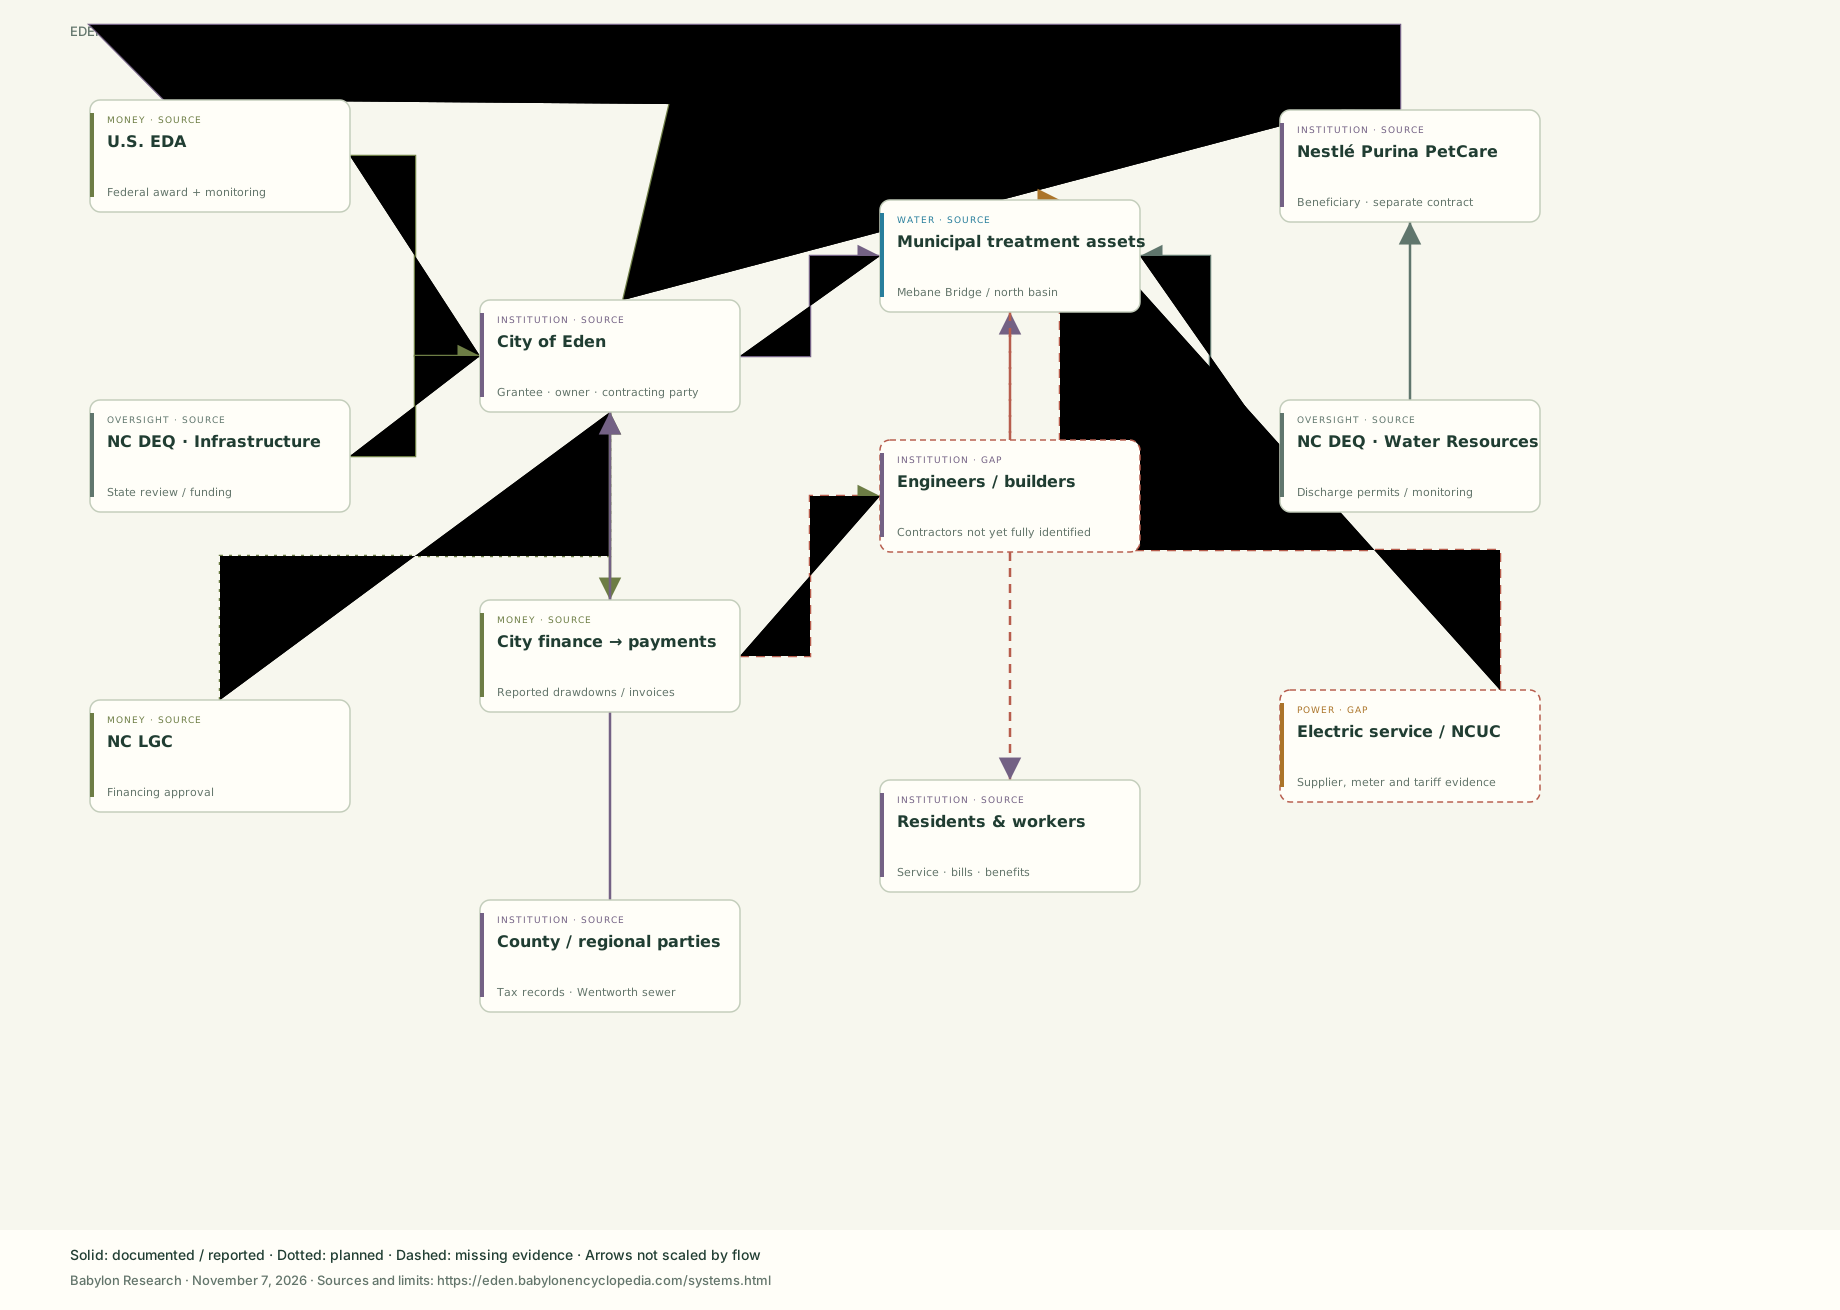
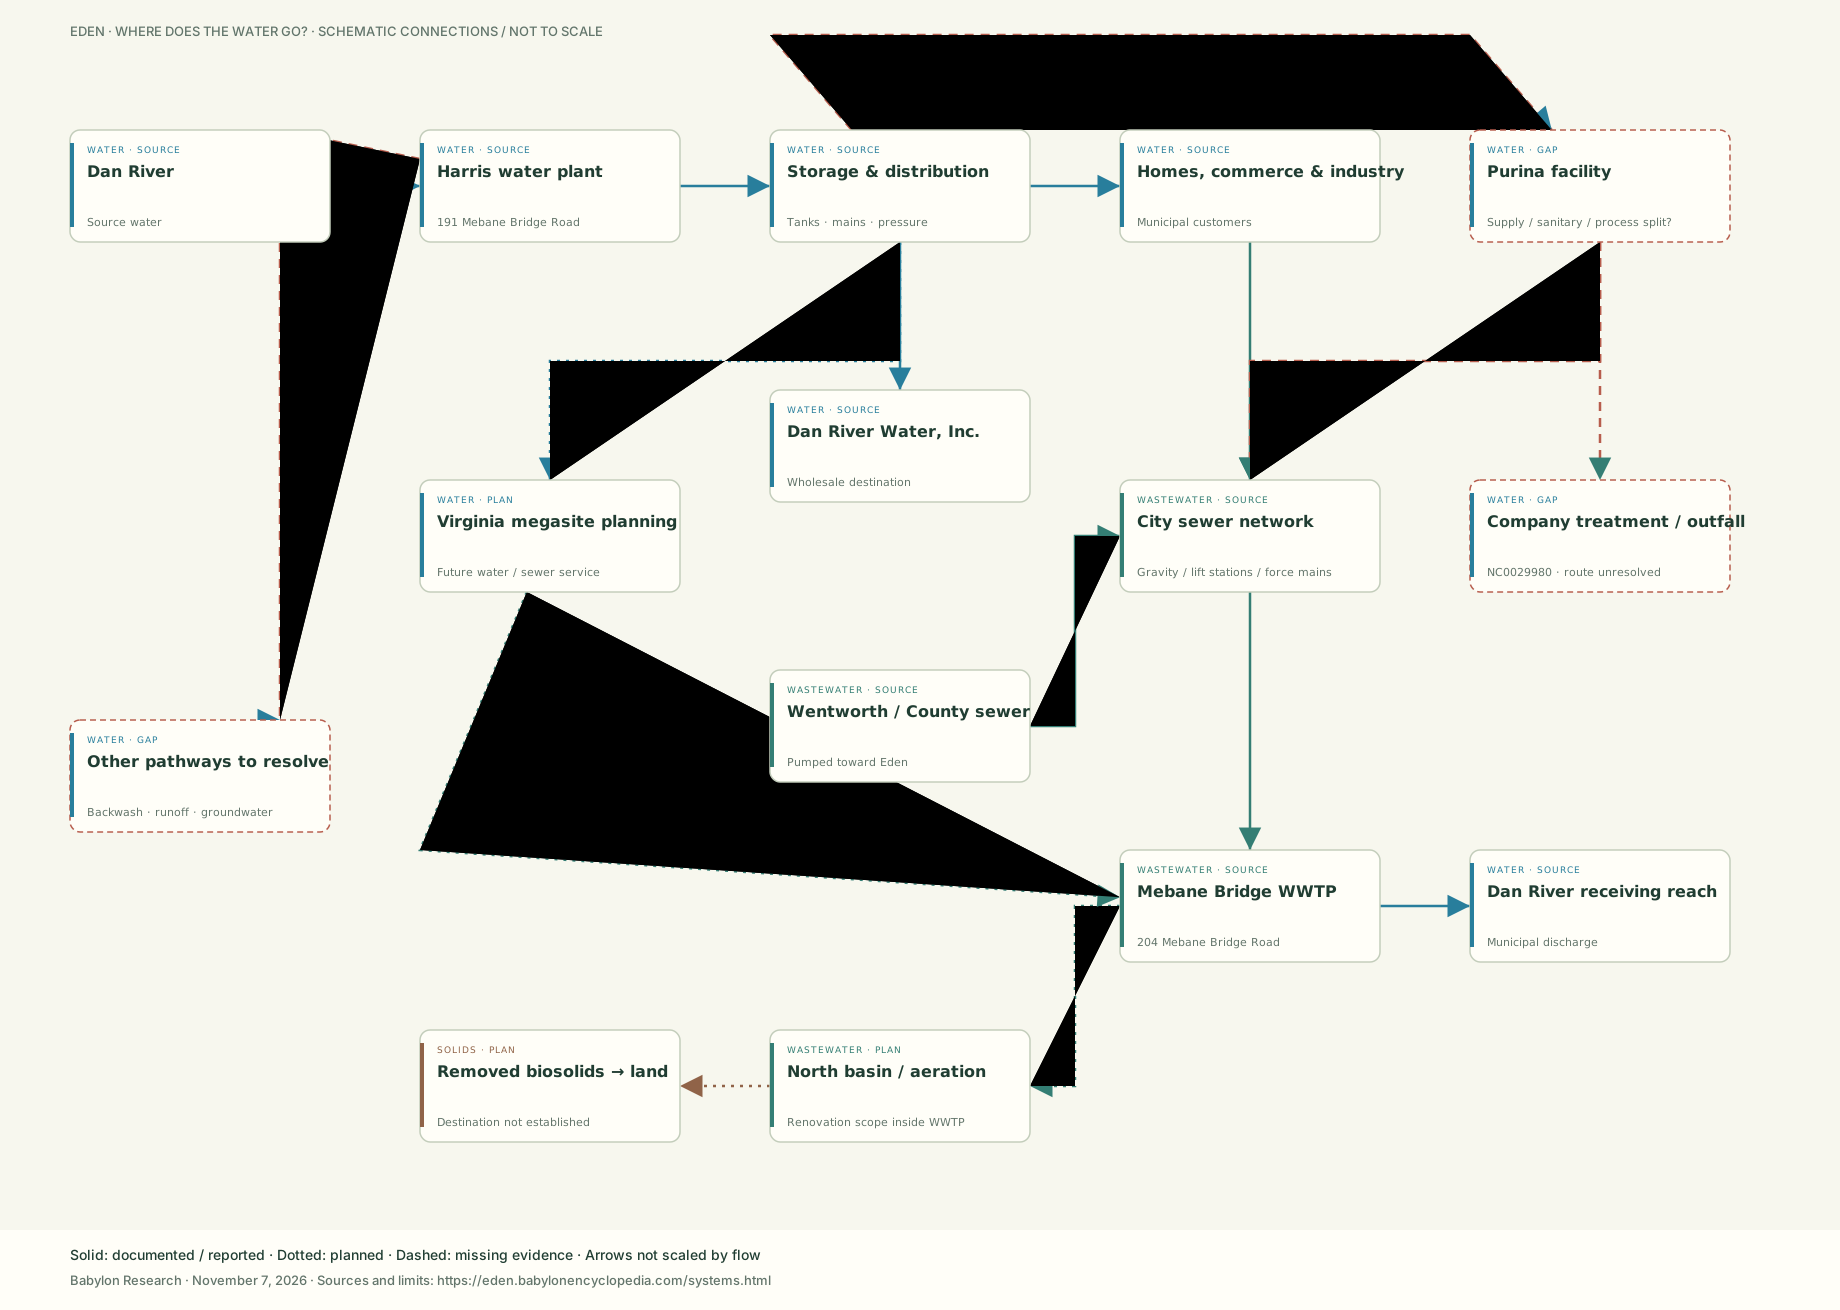
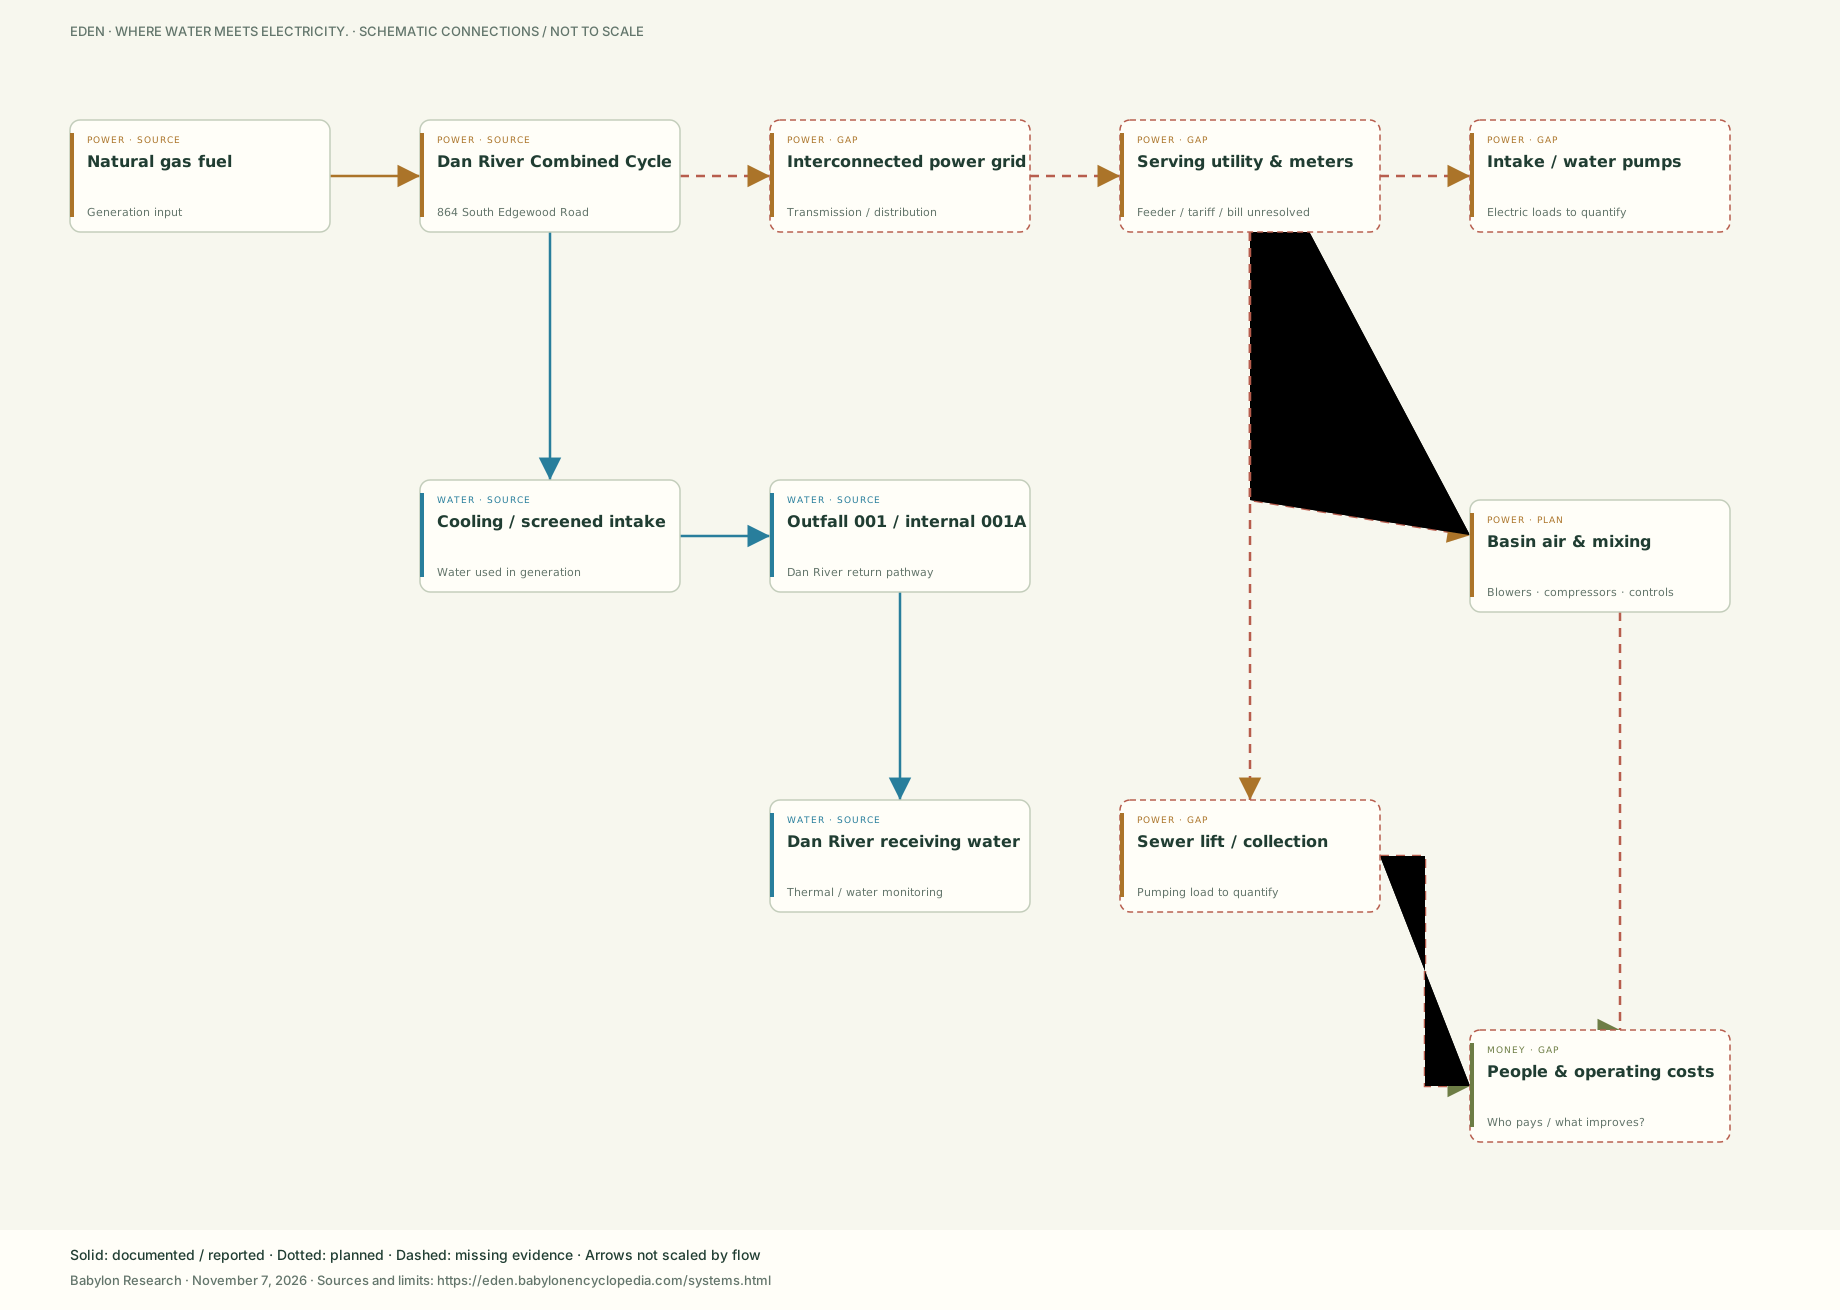
Two maps to connect decisions to the physical world—and a third to follow electricity. Select an asset, institution or arrow to see its evidence, missing records and the next question. See how water moves and electricity is made ↓
A sourced starting map, with its gaps visible. These diagrams show system connections, not surveyed pipe or cable routes. A complete physical map still needs as-built drawings, current permits, meters and operating records. Arrows are not scaled by flow.
The physical water map now explains the mechanism and electricity role at every stop. This sequence is an engineering guide; Eden’s exact equipment and routing still require the records listed beside each asset.
Screened water enters a raw-water route. Confirm the pumps and lift.
Treatment makes finished water; identify the actual process and residuals.
Motor-driven pressure and stored elevation move water through mains.
Sewer slopes move flow downhill; lift pumps overcome low points.
Powered aeration treats wastewater; verify the final discharge method.
EPA: water-system principles ↗ · EPA: lift stations ↗
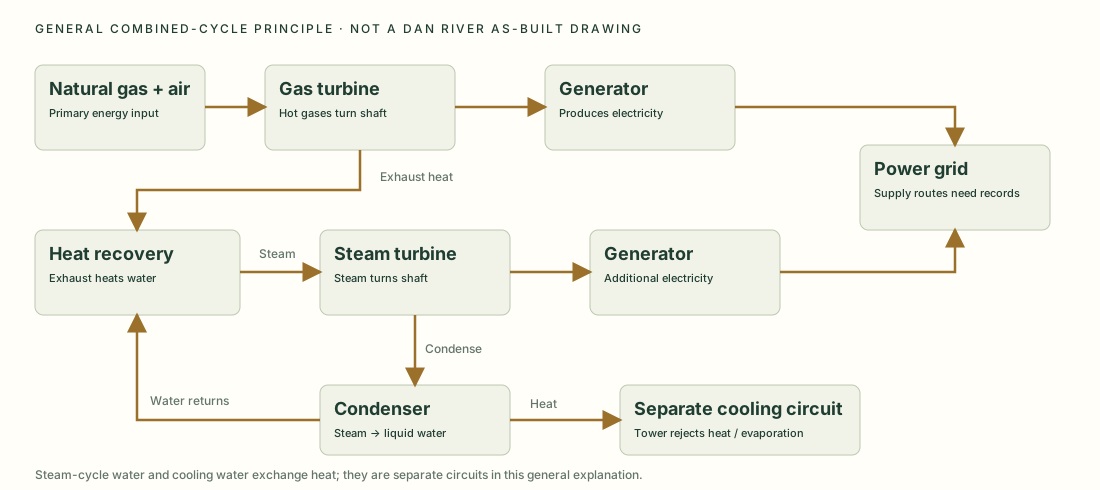
The Dan River station is documented as natural-gas combined cycle. Fuel turns a gas turbine; recovered exhaust heat makes steam for a second turbine. Water helps transfer and reject heat. This is different from hydropower, where falling or flowing water turns a turbine.
Save generation diagram SVGWhat remains unverified: the exact Dan River machinery layout, cooling makeup route and volumes, current output, and the supply connection to each municipal meter. No electricity generation at Eden’s water or wastewater plant has been established.
DOE: combined-cycle mechanism ↗ · GAO: cooling-water and steam circuits ↗
The water-supply report is submitted by the utility; NC DWR cautions that it is not field-verified. These averages are not a current-day reading or a closed water balance.
Read the 2025 utility report ↗
Inflow − outflow − change in storageAccount separately for delivered water, process use, evaporation, losses and measurement error. Drinking-water production and wastewater discharge have different boundaries: do not call their difference missing water.
Energy intensity = kWh ÷ volume treatedPair electricity bills and meter readings with flow and operating records. Compare equivalent treatment loads, quality and periods before claiming efficiency savings. A motor's rating is not its actual energy use.
EDA can clarify its funded scope and award file. City, County, NC DEQ and utility records are needed to complete the physical and operating map.